
Meena Hussain moved into her role as social media strategist at Greenpeace USA a year ago and discovered the organization has a lot of social networks, but she didn’t have the capacity to “be everywhere.”
“Being one person, managing several social networks, it is hard to see what should be prioritized, how often content should be posted,” says Meena, noting she was spending all her time on Facebook and Twitter.
Out of a necessity to spend less time posting on Facebook, the online team in the Washington, D.C.-based office decided to run some tests to determine the effectiveness of their Facebook posts.
With the new data and conversations that emerged from these tests, Meena and the online team have drastically changed how they look at social media.
What Sparked the Tests
Meena had been posting on Greenpeace USA’s Facebook page five to seven times daily.
In March, Meena was away from the office for a few weeks, leaving her social media work to two colleagues, online campaigners Dawn Bickett and Daniel Schreiber.
Dawn says she and Daniel knew, capacity-wise, they wouldn’t be able to handle posting five to seven times a day. They each created one original post for the day, putting a lot of time into creating the advocacy-focused content.
The content and posting style performed better than expected, prompting the idea to delve further into Facebook testing. They sought the help of Sho Fujiwara, Greenpeace USA decision support analyst, who responded enthusiastically to the data Facebook Insights offered.
“It made me excited, because I thought, ‘Wow, this is someone who actually understands this data,’” says Dawn.
Questions and Curiosities: Setting up the Test
During the initial discussion with Sho, Meena and Dawn shared their questions and curiosities about Facebook. Included in this discussion was the timing of posts, and the bump they would notice when people in the Pacific time zone logged on.
When Sho looked at the Facebook data he realized there was an abundance of data. In order to make sense of the metrics that was important to them, he considered ways to break down the data set into smaller groups that could be categorized and then analyzed.
Given the amount of data in Facebook Insights, he chose to focus on total reach as it reflects many of the other key metrics. He started categorizing posts by time of day and day of the week. Once it was possible to visualize the frequency and reach of posts, Sho discovered some interesting patterns.
He found posts were infrequently scheduled between 6 p.m. and midnight, however, when posts were published during this period they were well-received. This demonstrated an untapped audience during the evening time frame.
Having identified this trend, the group decided to see if posting more frequently in these time slots would result in a higher total reach, capitalizing on an audience that had been neglected.
Dawn also worked on categorizing the posts based on the mood they were likely to elicit, such as cheerful, scary, good news, motivational, inspiring and informational. She also tracked whether the posts were based on content from within Greenpeace or external sources.
“We have a much better overall picture of what posts were doing well, when they were doing well, and how often we should be posting,” says Dawn.
Raising the Floor
Throughout the month of April, the data brought to light the impact of external news on Greenpeace USA’s Facebook page reach.
External news related to climate or environmental issues, such as Hurricane Sandy and the Arkansas oil spill, showed high peaks as people look to Greenpeace for news and discussion. When news events outside of these topic areas occur, such as the Boston Marathon bombing, the data showed a decrease in reach.
Acknowledging these peaks and valleys as a natural occurrence, the team started to look at the baseline, or floor, of the page’s total reach as a reflection of the true value of the page. Their aim was to see an overall upward trend for total reach.
“It totally makes you think about social media strategy in a different way,” says Meena.
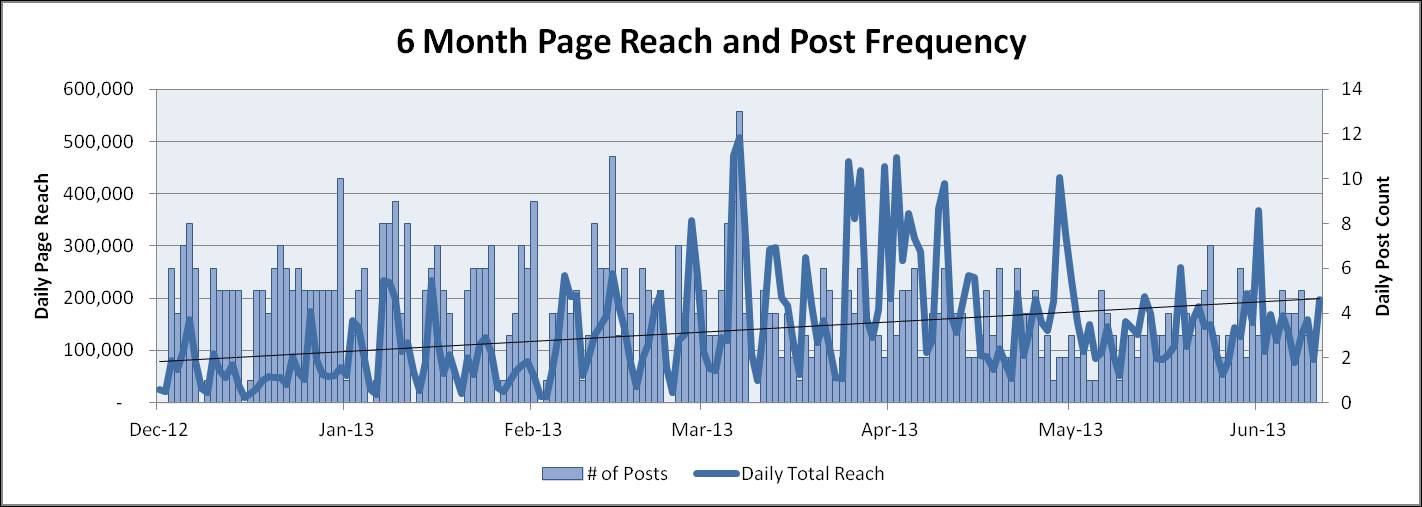
The black line on this graph shows the upward trend of daily total reach on Greenpeace USA’s Facebook page over a six month period. As the team learned and adapted from their tests, the daily total reach line increased consistently.
What’s Changed
Instead of focusing on the quantity of posts, the team focuses on consistently posting good content over 24 hours.
“I try to think of our content now more on a 24-hour cycle than on a nine-to-five cycle,” says Meena.
Dawn says the team feels more relaxed in the conversations about content because there is a focus on quality instead of quantity.
“It is a very different feel than it was earlier in the year,” says Dawn.
Meena echoes that it feels more relaxed, with her days being “a little less crazy” thanks to the new learning. With a few less Facebook posts to do she is able to focus on other projects such as Google analytics and promoting blog traffic.
Because of the analysis the team can make better decisions about what content to post.
They know good news does well, and that they shouldn’t, for example, try to create humorous posts because they are poorly received.
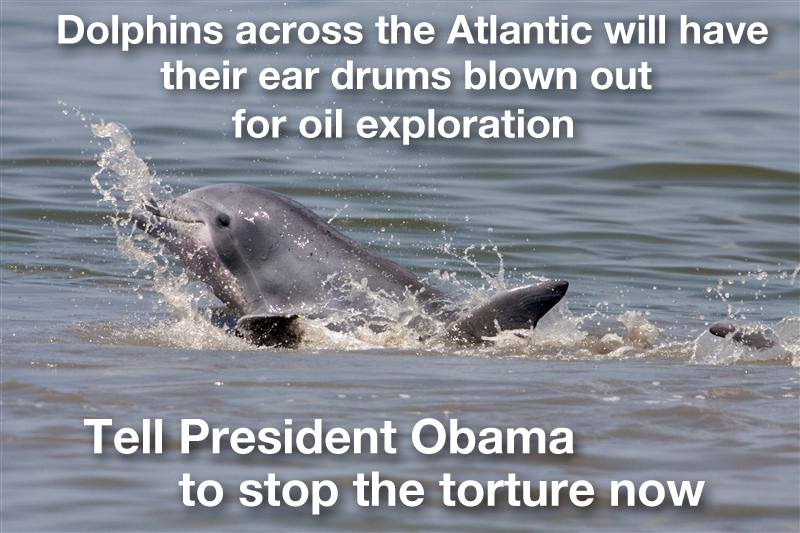
This Facebook image macro is one that performed well when posted.
Tips to Try
When asked what they would suggest to other people looking to better utilize Facebook, Meena says having someone who can understand the data is key. Sho suggests focusing on one or two key metrics, such as total reach or shares. He also recommends trying to categorize everything for each post. A post’s performance can be related to a number of factors including what the content is (a video, link, picture or status update), who wrote it and the time of day it was shared.
“All or none of those things might matter for whether or not a post does well, so unless we categorize each one and look at it systematically we’ll never know,” he says.
Listening to your community on Facebook and seeing what they react to is also important. Pay attention to comments, likes and shares and discover what issues the community finds most interesting.
Writing Facebook posts with a theory of change embedded is another tip learned through the data analysis. Telling supporters how to interact with the post, such as to share or like it, will increase the results.
“Make them feel like they can do something by interacting with this post and make a difference,” says Meena.
Being willing to try doing something different is another takeaway. Dawn and Meena say they are both more open to trying new things after this experience.
With Facebook posts continuing to be tested, team members are looking at other areas to explore.
Key Takeaways
- When analyzing data, focus on one or two metrics at a time
- Categorize posts as much as possible in order to find patterns
- Listen to your community and tailor your content based on what they react to
- Try posting during infrequent posting times to determine if there’s an audience that is being missed
- Think of content as being on a 24-hour schedule
- Be willing to try new posting approaches: scheduling, content, messaging etc.
- Create content that explicitly tells fans how to engage, such as like or share
- Focus on growing your baseline reach – don’t get lost in the peaks and valleys
Stay connected: @meenazahra @dawnmbickett @GreenpeaceUSA
Related posts:
Want more Facebook activity? Surprise them and make ‘em happy
Celebrating 1.5 million Facebook fans, Greenpeace Argentina shares lessons
Do you have an innovation in mobilisation or people-powered campaigns? Share it with Mob Lab by contacting MobLab@greenpeace.org.
Categories:
testing, learning and iteration

